AIAA Rotorcraft Hover Prediction Workshop (HPW)
AIAA Applied Aerodynamics Technical Committee
Suggested Data Processing
Integrated Performance
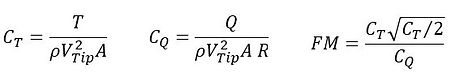
Integrated performance is a measure of the overall efficiency of a rotor system. Performance can be presented with plots of:
-
CT versus collective pitch
-
CQ versus collective pitch
-
CQ versus CT
-
Figure of Merit versus CT
where collective is measured at 75%R.
Distributed Loads
Detailed blade loading can be presented by section thrust and torque coefficients plotted as a function of r/R. These quantities are defined by:
Here c is the local chord.
Pressure Distribution
Blade loading can be further detailed with plots of pressure coefficient versus x/c. Cp is defined by:
The following radial stations, (r/R) should be considered: 0.20, 0.40, 0.60, 0.70, 0.75, 0.80, 0.85, 0.90, 0.925, 0.95, 0.975, 0.99.
Vortex Trajectory
Tip vortex trajectory plots should be provided as a function of wake age. The tip vortex trajectories should be plotted as z/ce from the blade tip trailing edge (zero displacement and zero wake age) versus wake age in degrees along with r/R versus wake age on a separate plot. The equivalent thrust-weightedchord is defined as:
The equivalent chord is defined assuming the chord is constant from the cutout to zero radial position
Vortex Core Size
The tip vortex core size should be plotted as core radius/ce versus wake age and the tip vortex circulation should be plotted as G/(ce WR) versus wake age.